
Lêer:South Africa 2011 dominant population group map.svg

Size of this PNG preview of this SVG file: 684 × 599 piksels. Ander resolusies: 274 × 240 piksels | 548 × 480 piksels | 876 × 768 piksels | 1 168 × 1 024 piksels | 2 337 × 2 048 piksels | 809 × 709 piksels.
Oorspronklike lêer (SVG-lêer, normaalweg 809 × 709 piksels, lêergrootte: 787 KG)
Opsomming
| Beskrywing |
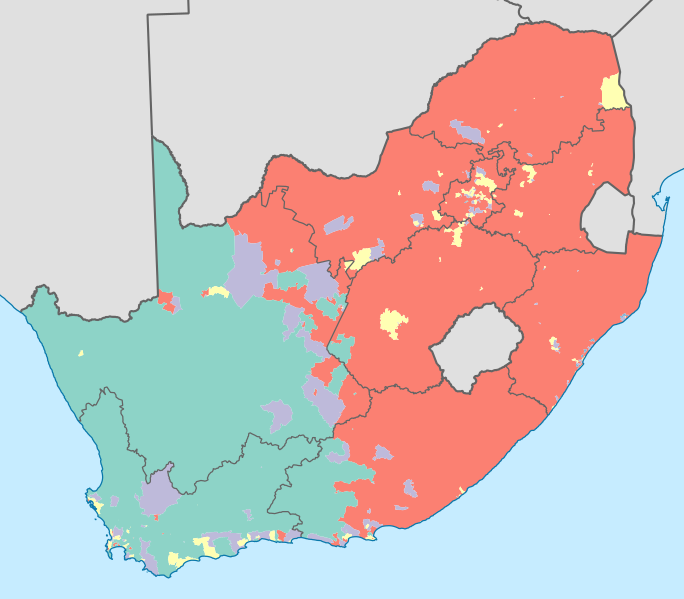
English: Map showing the dominant population groups in South Africa, according to Census 2011, at electoral ward level. A population group is considered dominant if it makes up more than 50% of the population in a ward, or if it makes up more than 33% and no other group makes up more than 25%.
Black African
Coloured
Indian or Asian
White
No group dominant
Projection is Albers Equal-Area Conic, with standard parallels at 25.5° S and 31.5° S, and origin at 28.5° S 25.5° E. |
| Datum | |
| Bron | Statistics South Africa's Census 2011 is the source of the basic population data. The map results from my own processing of the data. The map results from my own processing of the data. For ward boundaries see File:South Africa electoral wards 2011 blank.svg. |
| Outeur | Htonl |
| Ander weergawes |
South Africa 2011 dominant population group map (hex cells).svg: .svg) |
Lisensiëring
The following license applies to the population data on which the map is based:

|
The copyright holder of this file, Stats SA, allows anyone to use it for any purpose, provided that the copyright holder is properly attributed. Redistribution, derivative work, commercial use, and all other use is permitted. |
Naamsvermelding:
"the user acknowledges Stats SA as the source of the basic data wherever they process, apply, utilise, publish or distribute the data, and also that they specify that the relevant application and analysis (where applicable) result from their own processing of the data" [1]
|
The following tag applies to the map itself:
| Ek, die outeursreghouer van hierdie werk, stel dit hiermee in die publieke domein vry. Dit geld wêreldwyd. In sommige lande is dit dalk nie wettiglik moontlik nie. Indien so: Ek verleen aan enigiemand die reg om hierdie werk te gebruik vir enige doel, sonder voorwaardes, tensy sulke voorwaardes deur die wet vereis word. |
Lêergeskiedenis
Klik op die datum/tyd om te sien hoe die lêer destyds gelyk het.
| Datum/Tyd | Duimnael | Dimensies | Gebruiker | Opmerking | |
|---|---|---|---|---|---|
| huidig | 00:13, 17 April 2013 | | 809 × 709 (787 KG) | Htonl | =={{int:filedesc}}== {{Information |Description={{en|1=Map showing the dominant population groups in South Africa, according to Census 2011, at electoral ward level. A population group is considered dominant if it makes up more than 50% of the populati... |
Lêergebruik
Die volgende 2 bladsye gebruik dié lêer:
Globale lêergebruik
Die volgende ander wiki's gebruik hierdie lêer:
- Gebruik in cs.wikipedia.org
- Gebruik in es.wikipedia.org
- Gebruik in fr.wikipedia.org
- Gebruik in he.wikipedia.org
- Gebruik in it.wikipedia.org
- Gebruik in ka.wikipedia.org
- Gebruik in pt.wikipedia.org
- Gebruik in ro.wikipedia.org
- Gebruik in ru.wikipedia.org
- Gebruik in sr.wikipedia.org
- Gebruik in tg.wikipedia.org
- Gebruik in uk.wikipedia.org
- Gebruik in zh.wikipedia.org