
Lêer:Evolution of temperature in the Post-Glacial period according to Greenland ice cores.jpg
Grootte van hierdie voorskou: 800 × 222 piksels. Ander resolusies: 320 × 89 piksels | 640 × 178 piksels | 1 786 × 496 piksels.
Oorspronklike lêer (1 786 × 496 piksels, lêergrootte: 281 KG, MIME-tipe: image/jpeg)
Opsomming
| Beskrywing |
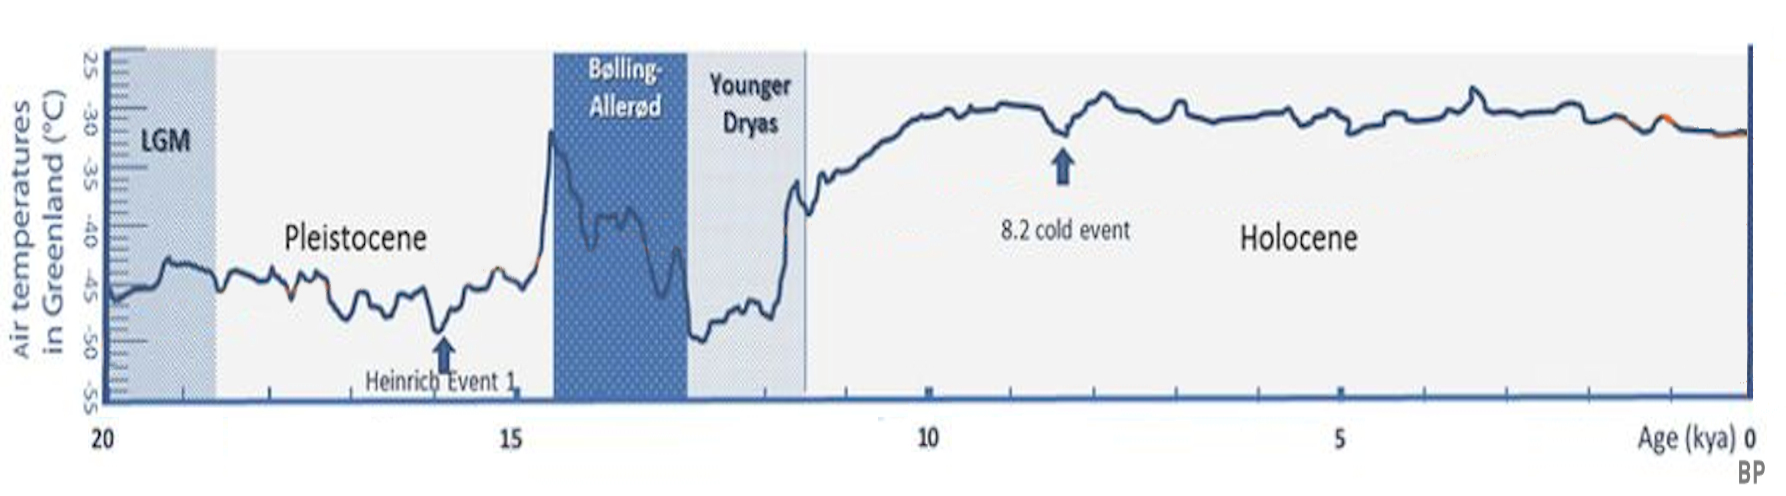
English: Reconstructed air temperatures from the GISP 2 Ice core in Greenland |
||
| Datum | |||
| Bron |
Mapping Post-Glacial expansions: The Peopling of Southwest Asia |
||
| Outeur | Daniel E. Platt, Marc Haber, Magda Bou Dagher-Kharrat, Bouchra Douaihy, Georges Khazen, Maziar Ashrafian Bonab, Angélique Salloum, Francis Mouzaya, Donata Luiselli, Chris Tyler-Smith, Colin Renfrew, Elizabeth Matisoo-Smith & Pierre A. Zalloua | ||
| Ander weergawes |
|


Lisensiëring
This file is licensed under the Creative Commons Attribution-Share Alike 4.0 International license.
- U is vry:
- om te deel – die werk kopieer, versprei en deurgee
- om te hermeng – om die werk aan te pas
- Onder die volgende voorwaardes:
- naamsvermelding – U moet die nodige krediet gee, 'n skakel na die lisensie verskaf en aandui of daar veranderinge aangebring is. U mag dit op enige redelike manier doen, maar nie op enige manier wat daarop dui dat die lisensiegewer u of u gebruik onderskryf nie.
- insgelyks – As u die materiaal hermix, transformeer of voortbou, moet u u bydraes versprei onder die dieselfde of versoenbare lisensie as die oorspronklike.
Lêergeskiedenis
Klik op die datum/tyd om te sien hoe die lêer destyds gelyk het.
| Datum/Tyd | Duimnael | Dimensies | Gebruiker | Opmerking | |
|---|---|---|---|---|---|
| huidig | 20:41, 16 Mei 2019 | 1 786 × 496 (281 KG) | पाटलिपुत्र | better | |
| 11:24, 16 Mei 2019 | 1 786 × 372 (238 KG) | पाटलिपुत्र | User created page with UploadWizard |
Lêergebruik
Die volgende bladsy gebruik dié lêer:
Globale lêergebruik
Die volgende ander wiki's gebruik hierdie lêer:
- Gebruik in ar.wikipedia.org
- Gebruik in ca.wikipedia.org
- Gebruik in de.wikipedia.org
- Gebruik in en.wikipedia.org
- Gebruik in es.wikipedia.org
- Gebruik in fr.wikipedia.org
- Gebruik in he.wikipedia.org
- Gebruik in id.wikipedia.org
- Gebruik in ie.wikipedia.org
- Gebruik in it.wikipedia.org
- Gebruik in ja.wikipedia.org
- Gebruik in kk.wikipedia.org
- Gebruik in lfn.wikipedia.org
- Gebruik in ms.wikipedia.org
- Gebruik in ru.wikipedia.org
- Gebruik in te.wikipedia.org
- Gebruik in th.wikipedia.org
- Gebruik in tr.wikipedia.org
- Gebruik in vi.wikipedia.org
- Gebruik in zh.wikipedia.org