
Lêer:South Africa 2001 Coloured population density map.svg

Size of this PNG preview of this SVG file: 689 × 600 piksels. Ander resolusies: 276 × 240 piksels | 552 × 480 piksels | 882 × 768 piksels | 1 177 × 1 024 piksels | 2 353 × 2 048 piksels | 1 072 × 933 piksels.
Oorspronklike lêer (SVG-lêer, normaalweg 1 072 × 933 piksels, lêergrootte: 1,01 MG)
Opsomming
| Beskrywing |
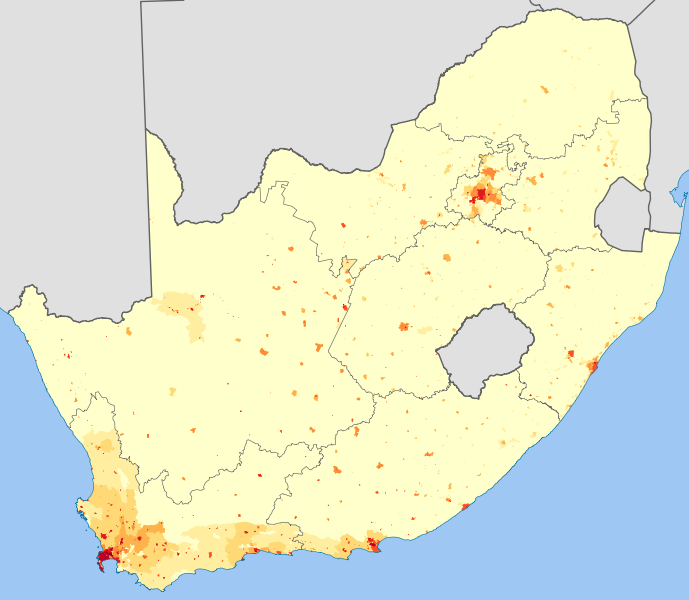
English: Density of people in South Africa self-describing as "Coloured", at the Census "Main Place" level.
<1 person/km²
1–3 people/km²
3–10 people/km²
10–30 people/km²
30–100 people/km²
100–300 people/km²
300–1000 people/km²
1000–3000 people/km²
>3000 people/km²
Projection is Albers Equal-Area Conic, with standard parallels at 25.5° S and 31.5° S, and origin at 28.5° S 25.5° E. |
| Datum | |
| Bron | Statistics South Africa's Census 2001 is the source of the basic population data. The map results from my own processing of the data. |
| Outeur | Htonl |
Lisensiëring
The following license applies to the population data on which the map is based:

|
The copyright holder of this file, Stats SA, allows anyone to use it for any purpose, provided that the copyright holder is properly attributed. Redistribution, derivative work, commercial use, and all other use is permitted. |
Naamsvermelding:
"the user acknowledges Stats SA as the source of the basic data wherever they process, apply, utilise, publish or distribute the data, and also that they specify that the relevant application and analysis (where applicable) result from their own processing of the data" [1]
|
The following tag applies to the map itself:
| Ek, die outeursreghouer van hierdie werk, stel dit hiermee in die publieke domein vry. Dit geld wêreldwyd. In sommige lande is dit dalk nie wettiglik moontlik nie. Indien so: Ek verleen aan enigiemand die reg om hierdie werk te gebruik vir enige doel, sonder voorwaardes, tensy sulke voorwaardes deur die wet vereis word. |
Lêergeskiedenis
Klik op die datum/tyd om te sien hoe die lêer destyds gelyk het.
| Datum/Tyd | Duimnael | Dimensies | Gebruiker | Opmerking | |
|---|---|---|---|---|---|
| huidig | 12:26, 3 April 2012 | | 1 072 × 933 (1,01 MG) | Htonl | styles, color handling |
| 02:17, 2 Oktober 2010 |  | 1 072 × 933 (1,2 MG) | Htonl | new approach, smaller filesize | |
| 18:02, 1 Oktober 2010 |  | 1 072 × 933 (2,92 MG) | Htonl | use equal-area projection | |
| 18:56, 16 Februarie 2010 |  | 1 000 × 786 (2,81 MG) | Htonl | tweak | |
| 19:38, 6 Februarie 2010 |  | 1 000 × 786 (3,04 MG) | Htonl | tweak | |
| 18:58, 6 Februarie 2010 |  | 1 000 × 786 (2,87 MG) | Htonl | == Summary == {{Information |Description={{en|1=Density of people in South Africa self-describing as "Coloured", at the Census "Main Place" level. {{legend|#ffffcc|<1 person/km²}} {{legend|#ffeda0|1–3 people/km²}} {{legend|#fed976|3–10 people/km� |
Lêergebruik
Daar is geen bladsye wat dié lêer gebruik nie.